

Advanced Find Functions & Example
💡 Find Your Data And Generating Reports
Now, let’s see how to select the data and generate a report. For this example, we will:
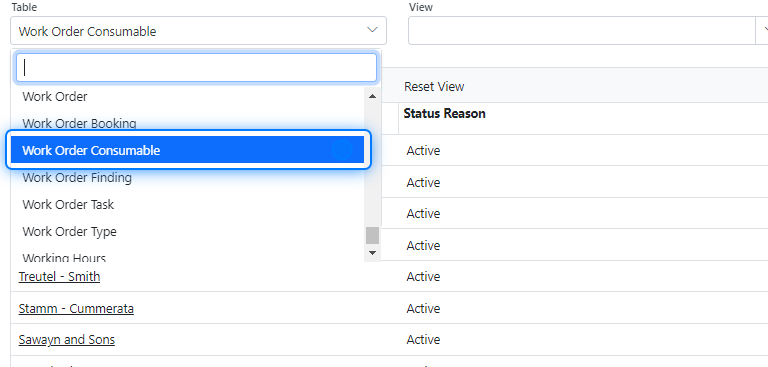
Select the Work Order Consumable Table .
Group the data by work order .
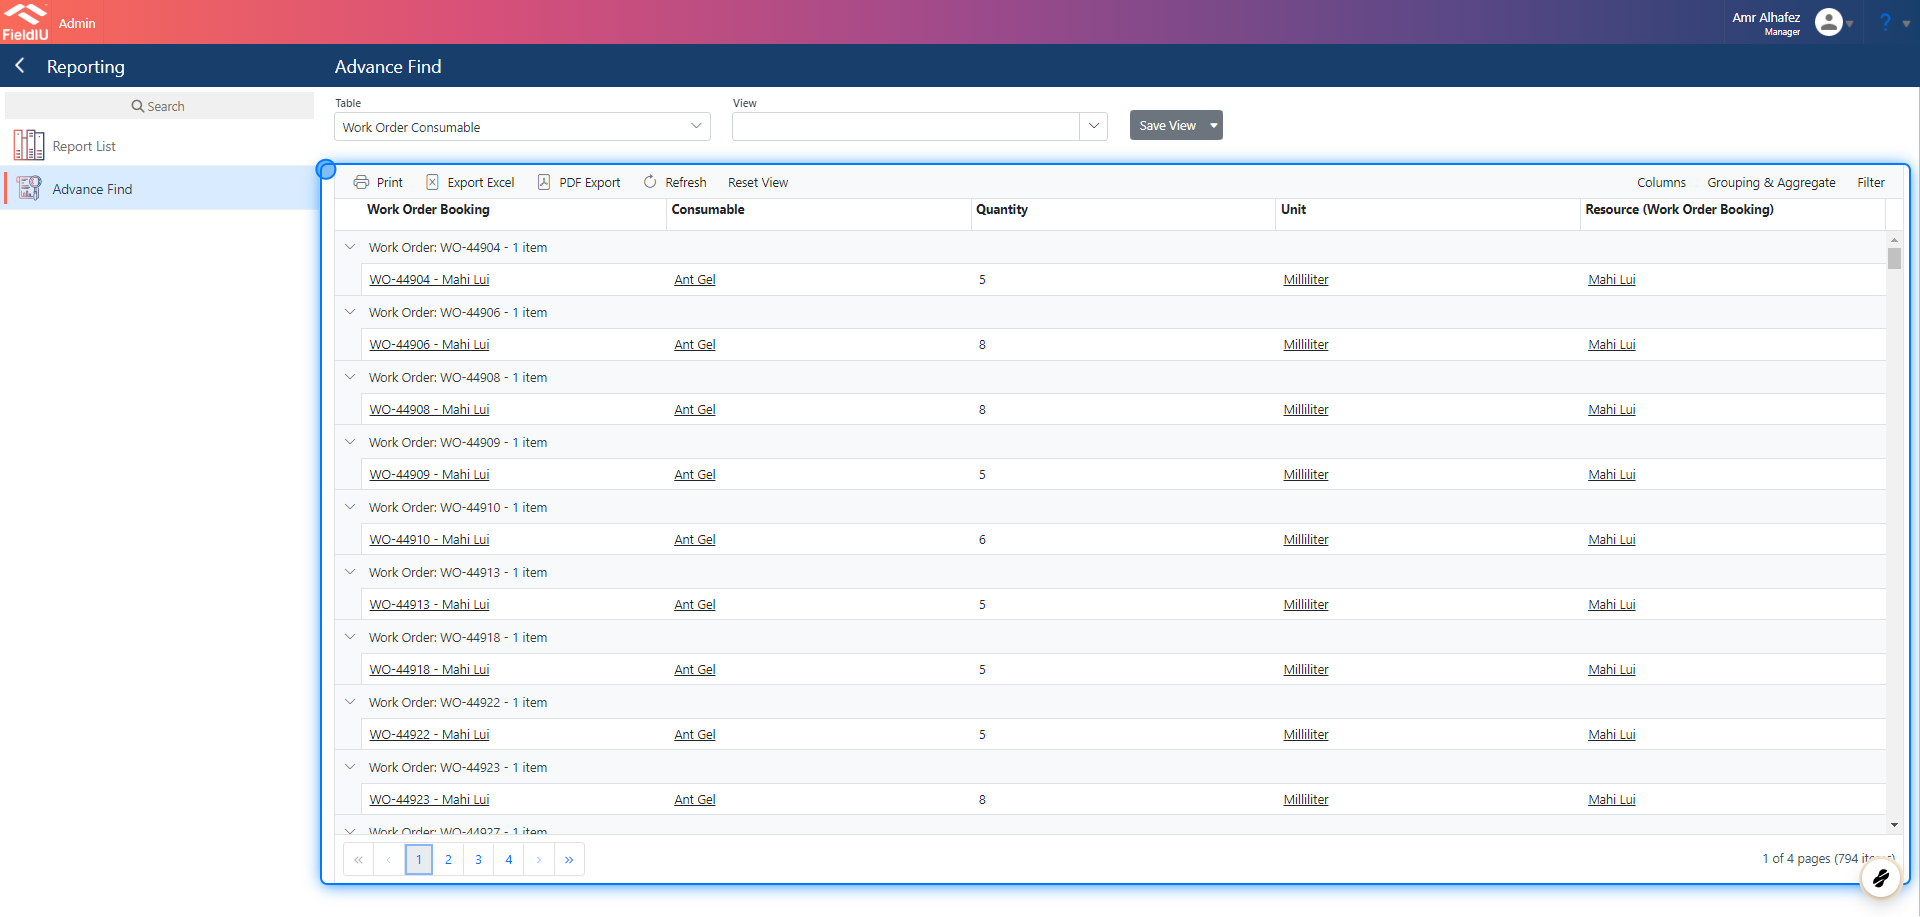
Filter the data to include only Ant Gel .
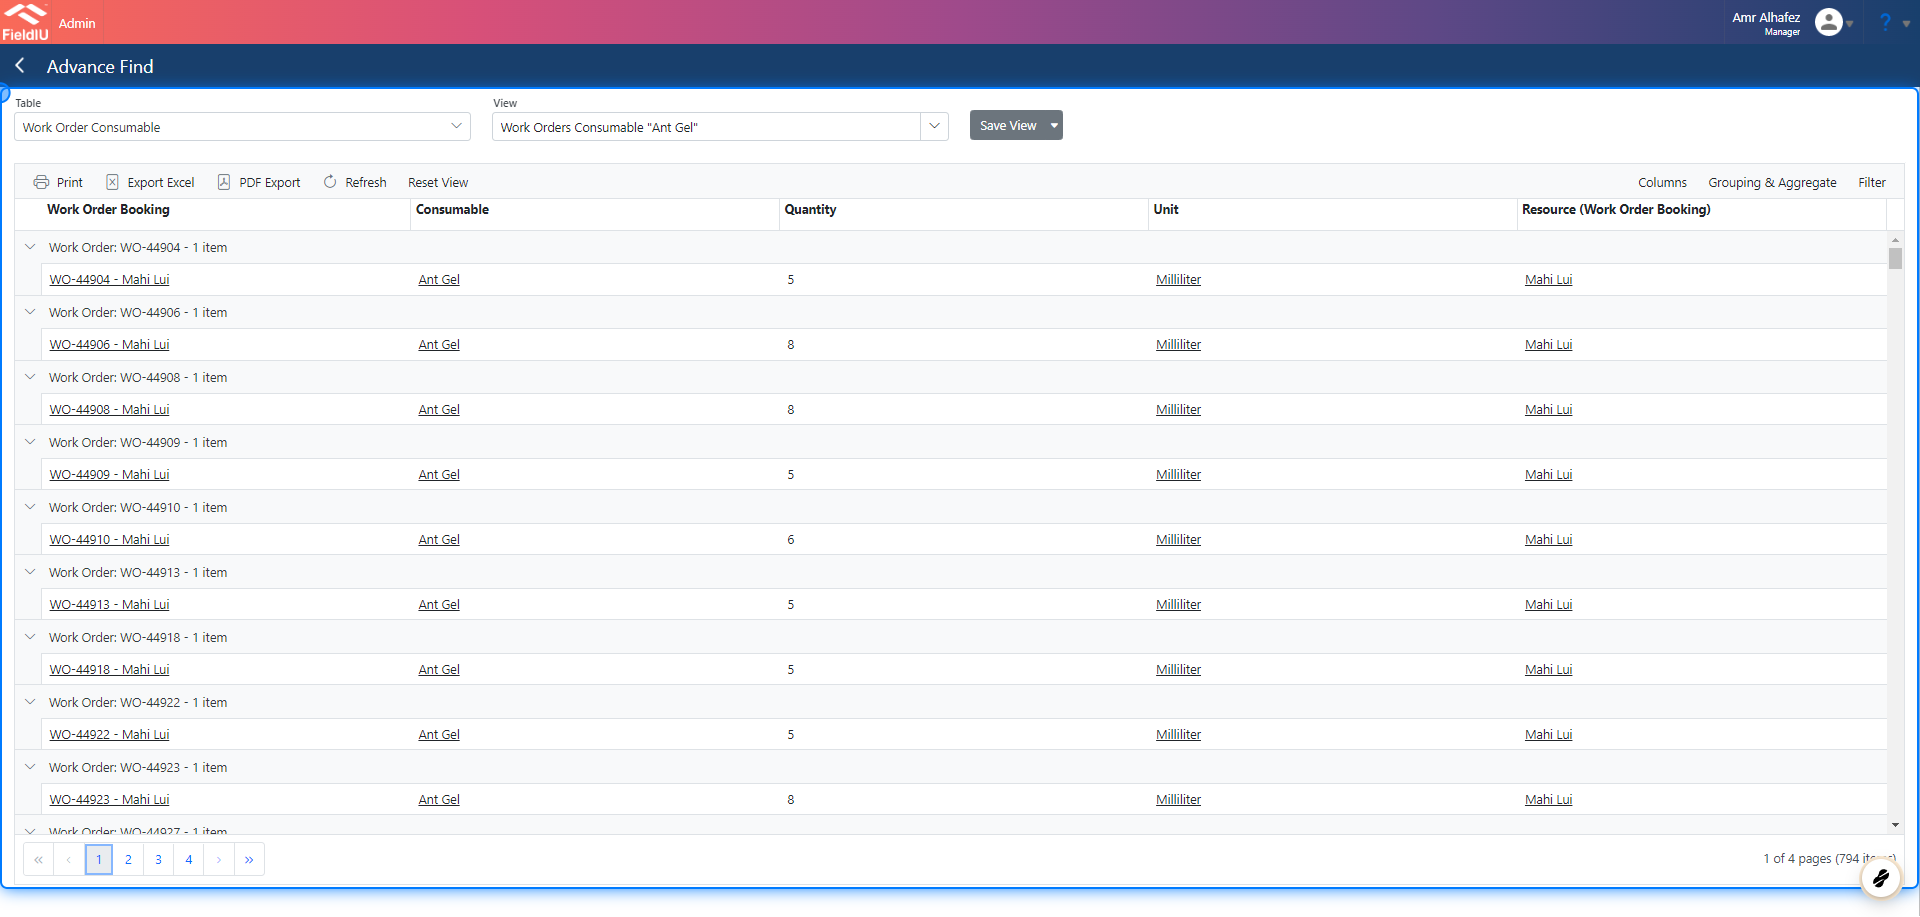
This will produce a report showing all consumables used in work order bookings, grouped by work order and filtered for Ant Gel.
1. Selecting the Table
We selected the Work Order Consumable table for our scenario.
2. Select The Columns
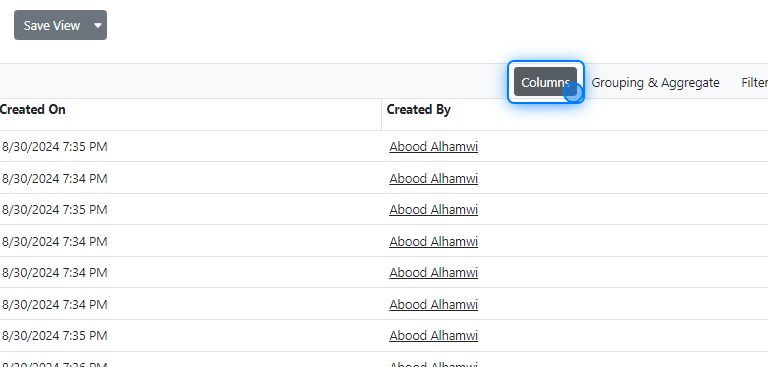
Now, we need to select the columns of data we want to display in our table or grid.
Simply click the Columns button, and a window listing the available columns will appear.
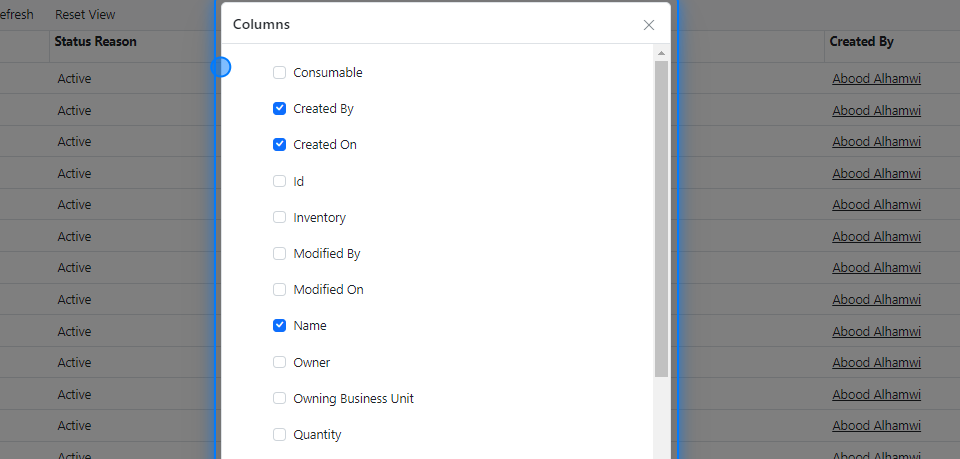
3. Columns Tables
In this window, you will find all the columns related to the Work Order Consumable table, such as Work Order Booking , Work Order , and others.
4. Select Data Columns
5. Related Tables
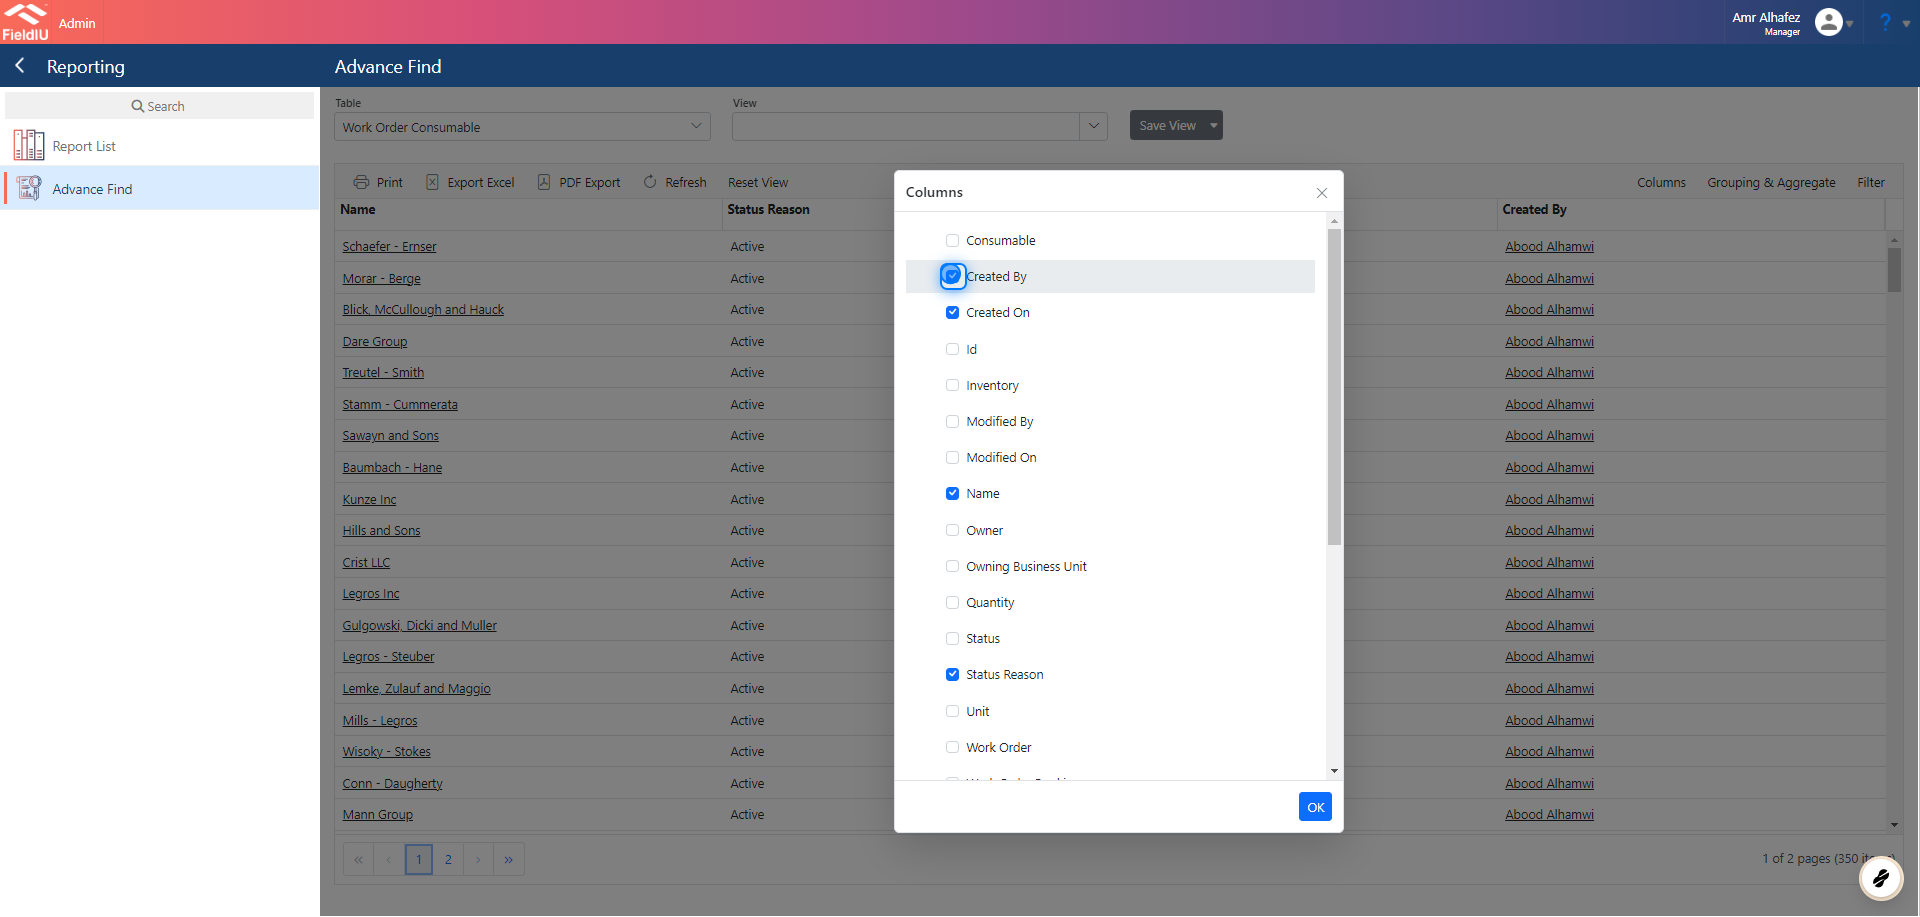
If you scroll, you will find all the related columns for the main table we selected, Work Order Consumable . You can select any column from this list. In our example, we will choose the column that specifies the resource responsible for making the booking in the work order.
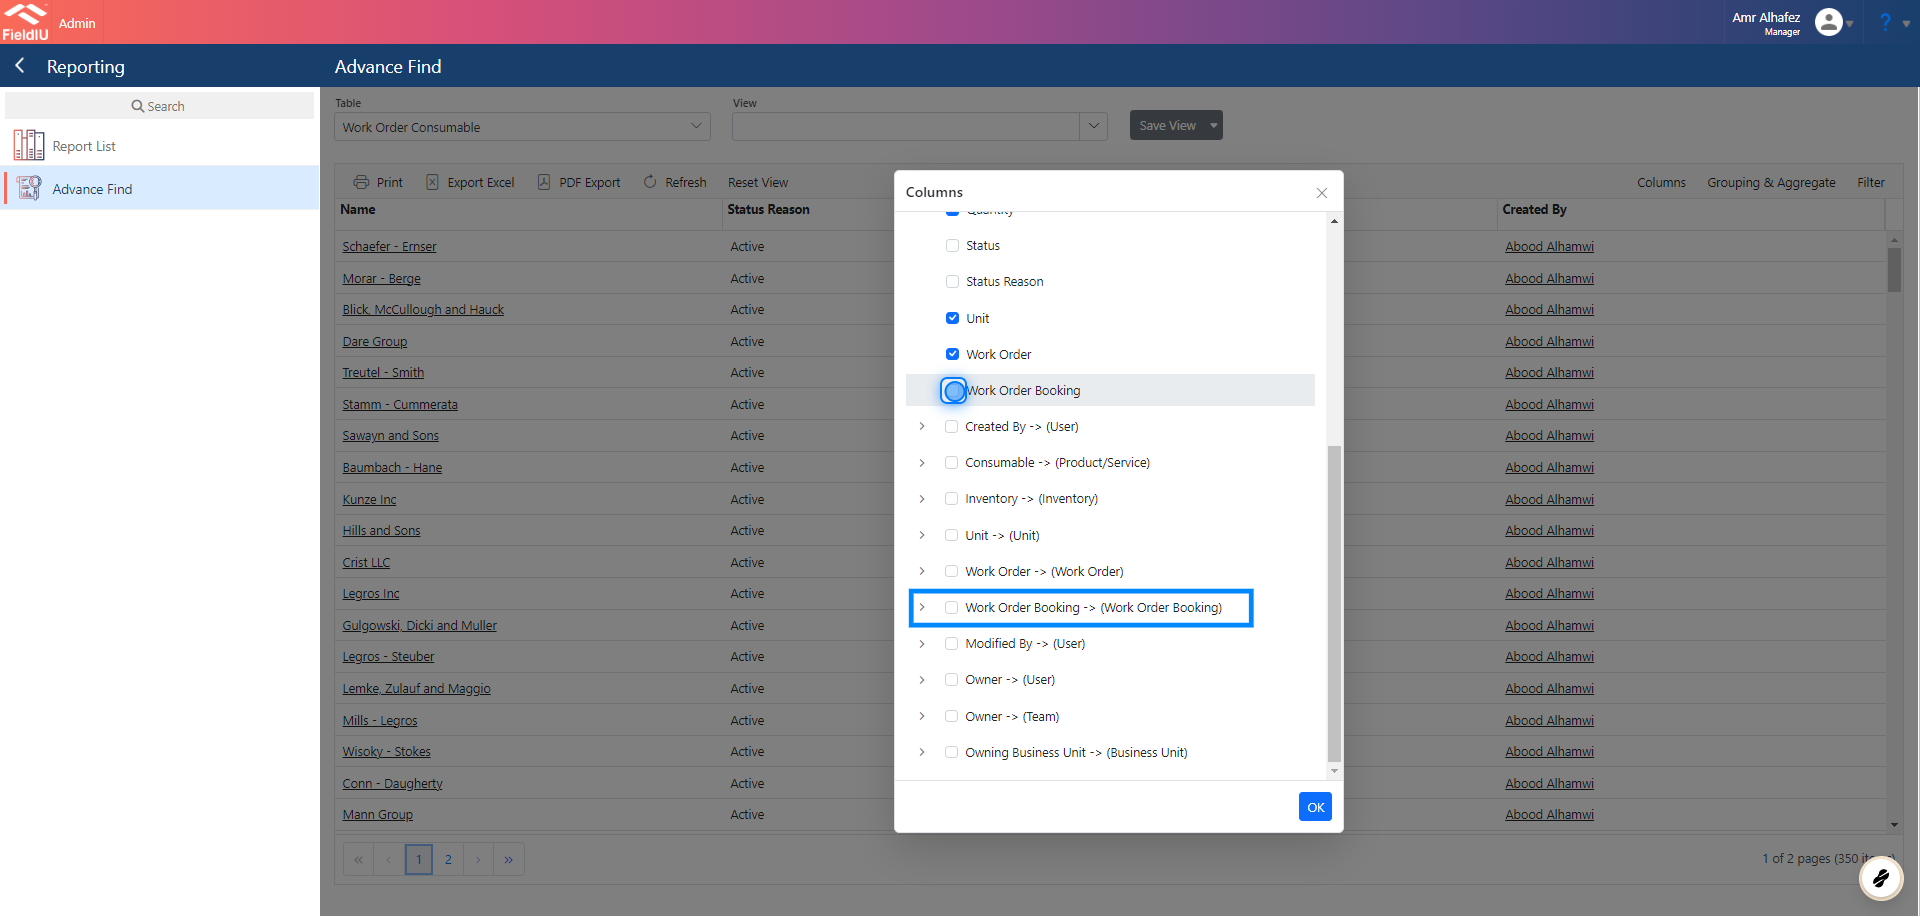
💡 Resource
The Resource column is only available in the Work Order Booking table. Therefore, you need to select it from the related table to the Work Order Consumable table.
6. New View
After selecting the columns and pressing OK , the chosen columns will appear in the Data Grid.
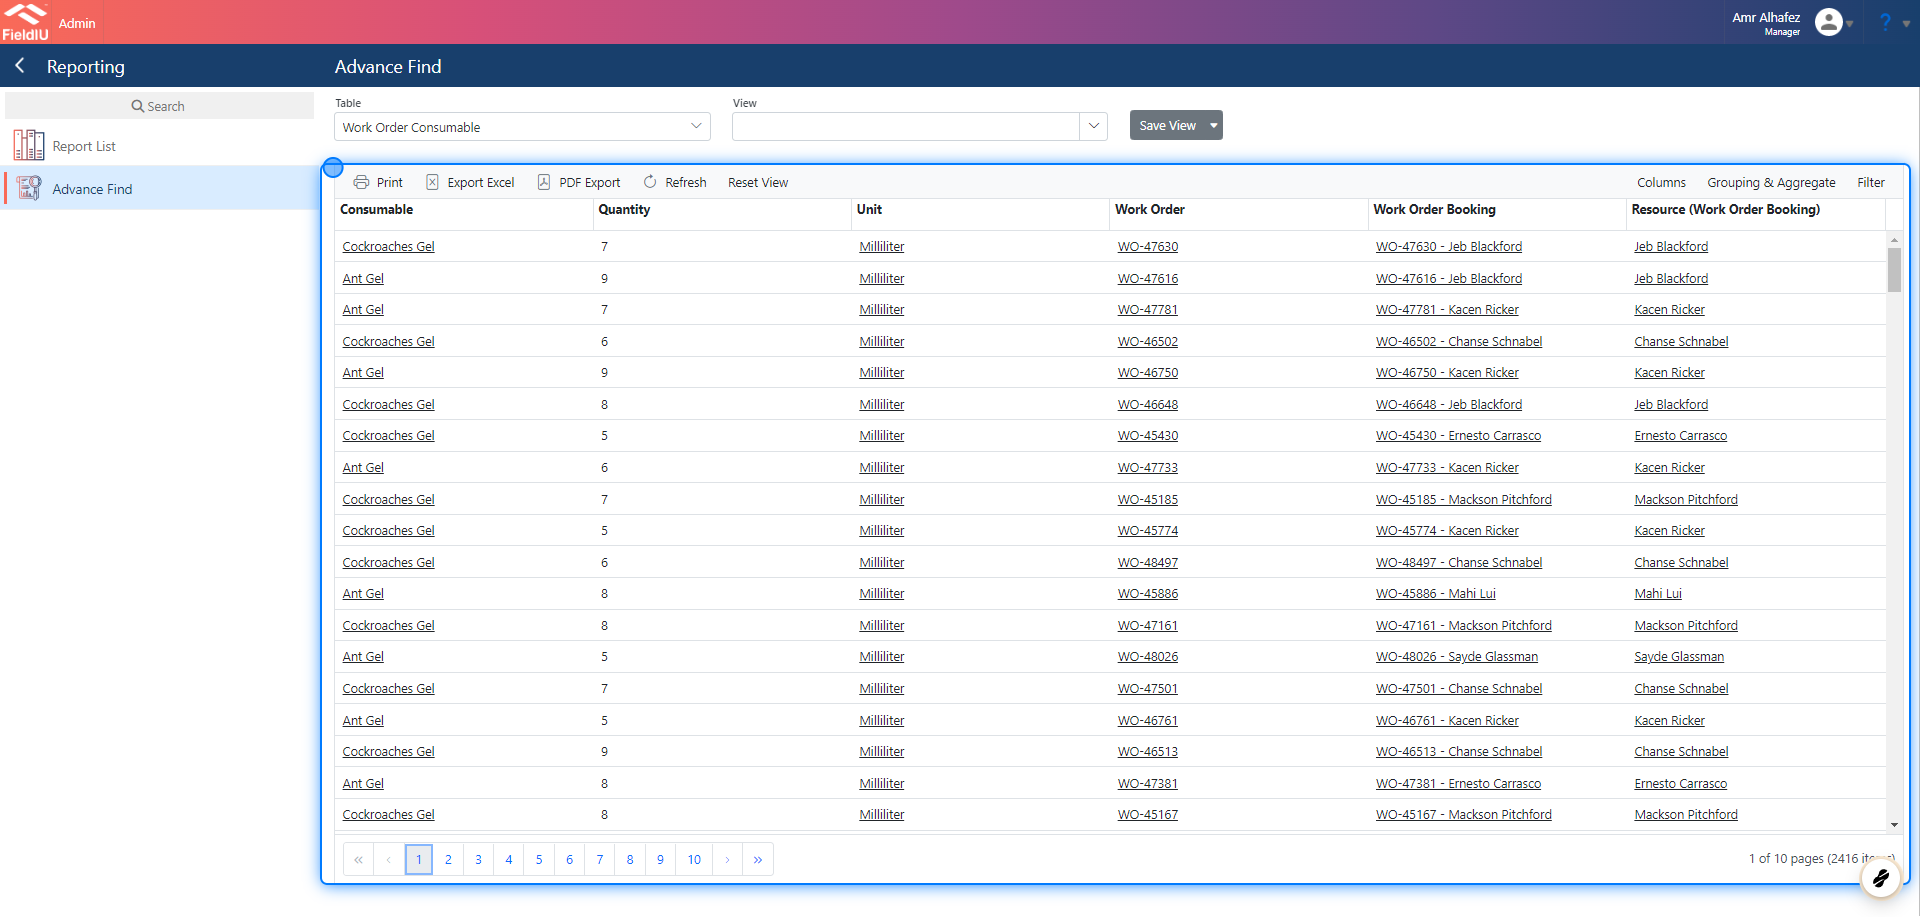
Columns Moving
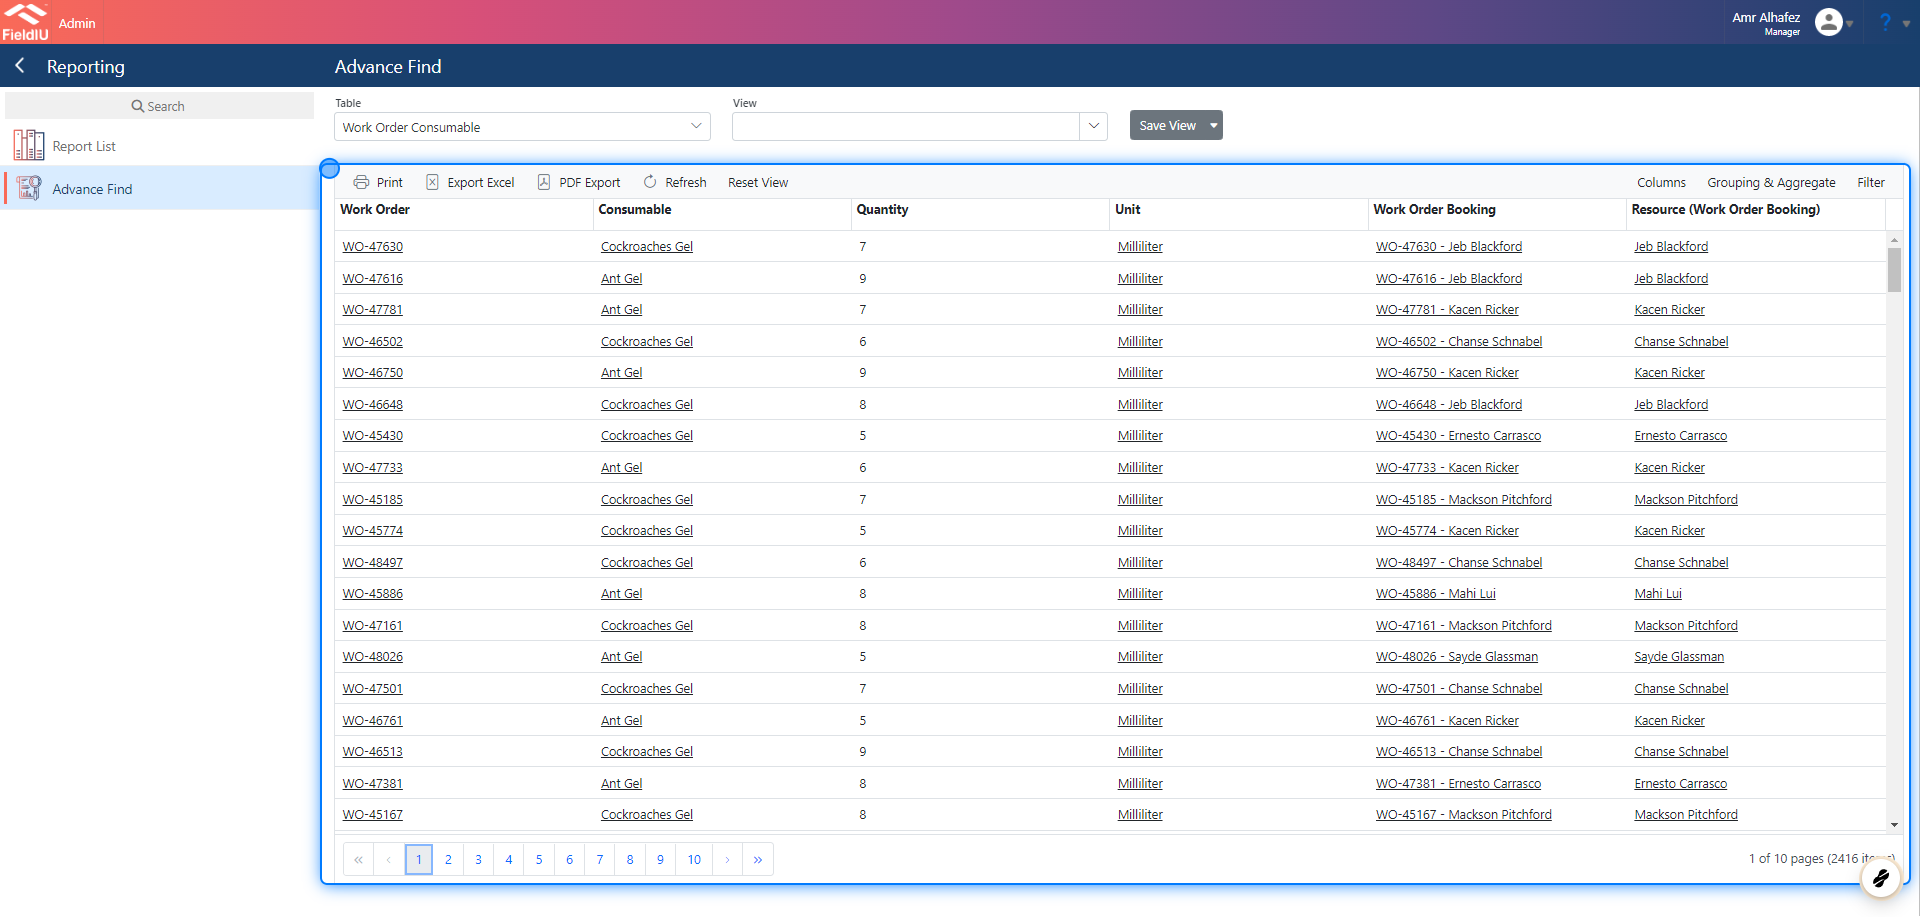
7. Drag And Drop
By dragging and dropping any column, you can move it to your desired position.
Grouping & Aggregate
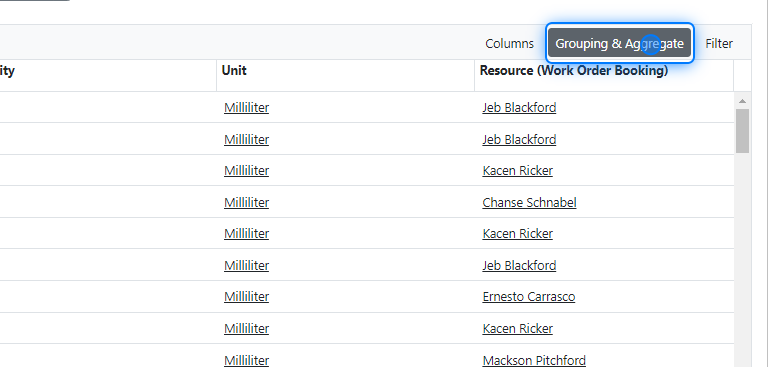
8.
You can aggregate and group the data as needed.
Simply click on Grouping & Aggregate Button.
9. Grouping & Aggregate Window
you can find here all the necessary functions for grouping and aggregating the data.
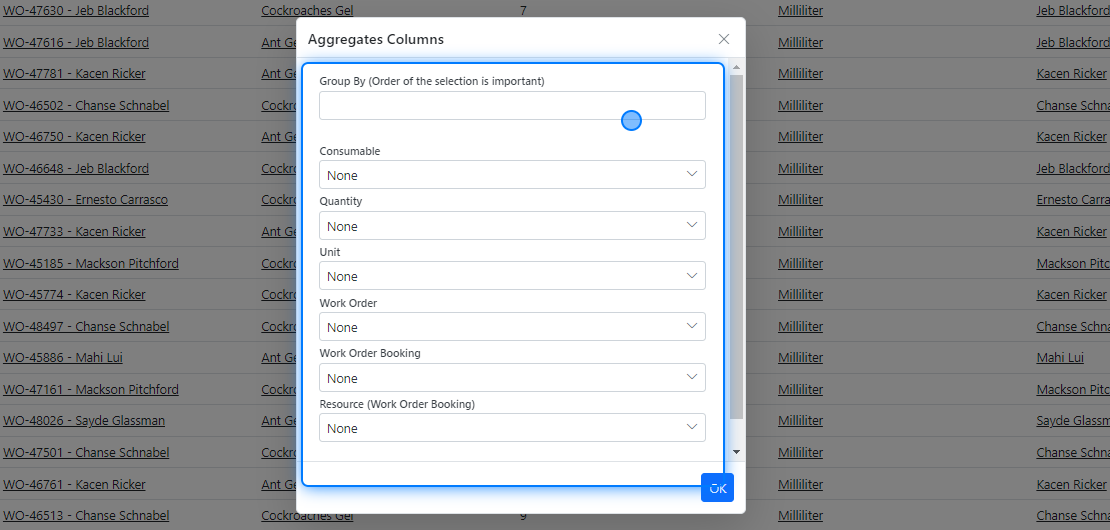
💡 What is grouping?
Grouping involves organizing multiple data rows into unique groups. In our example, we will group the data by work order.
10. Grouping
Simply select the header for grouping from the first text box.
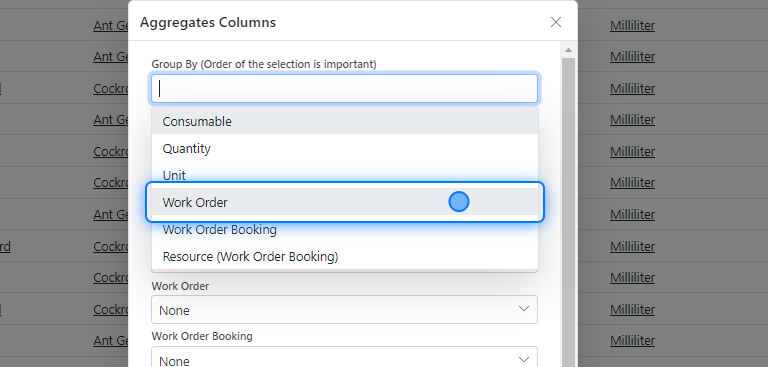
💡 Some Extra Tips for Grouping !
You can select multiple grouping headers.
The list of group headers will be the same as the columns you selected previously.
💡 What is Aggregating ?
The aggregate function helps by providing a count of the data.
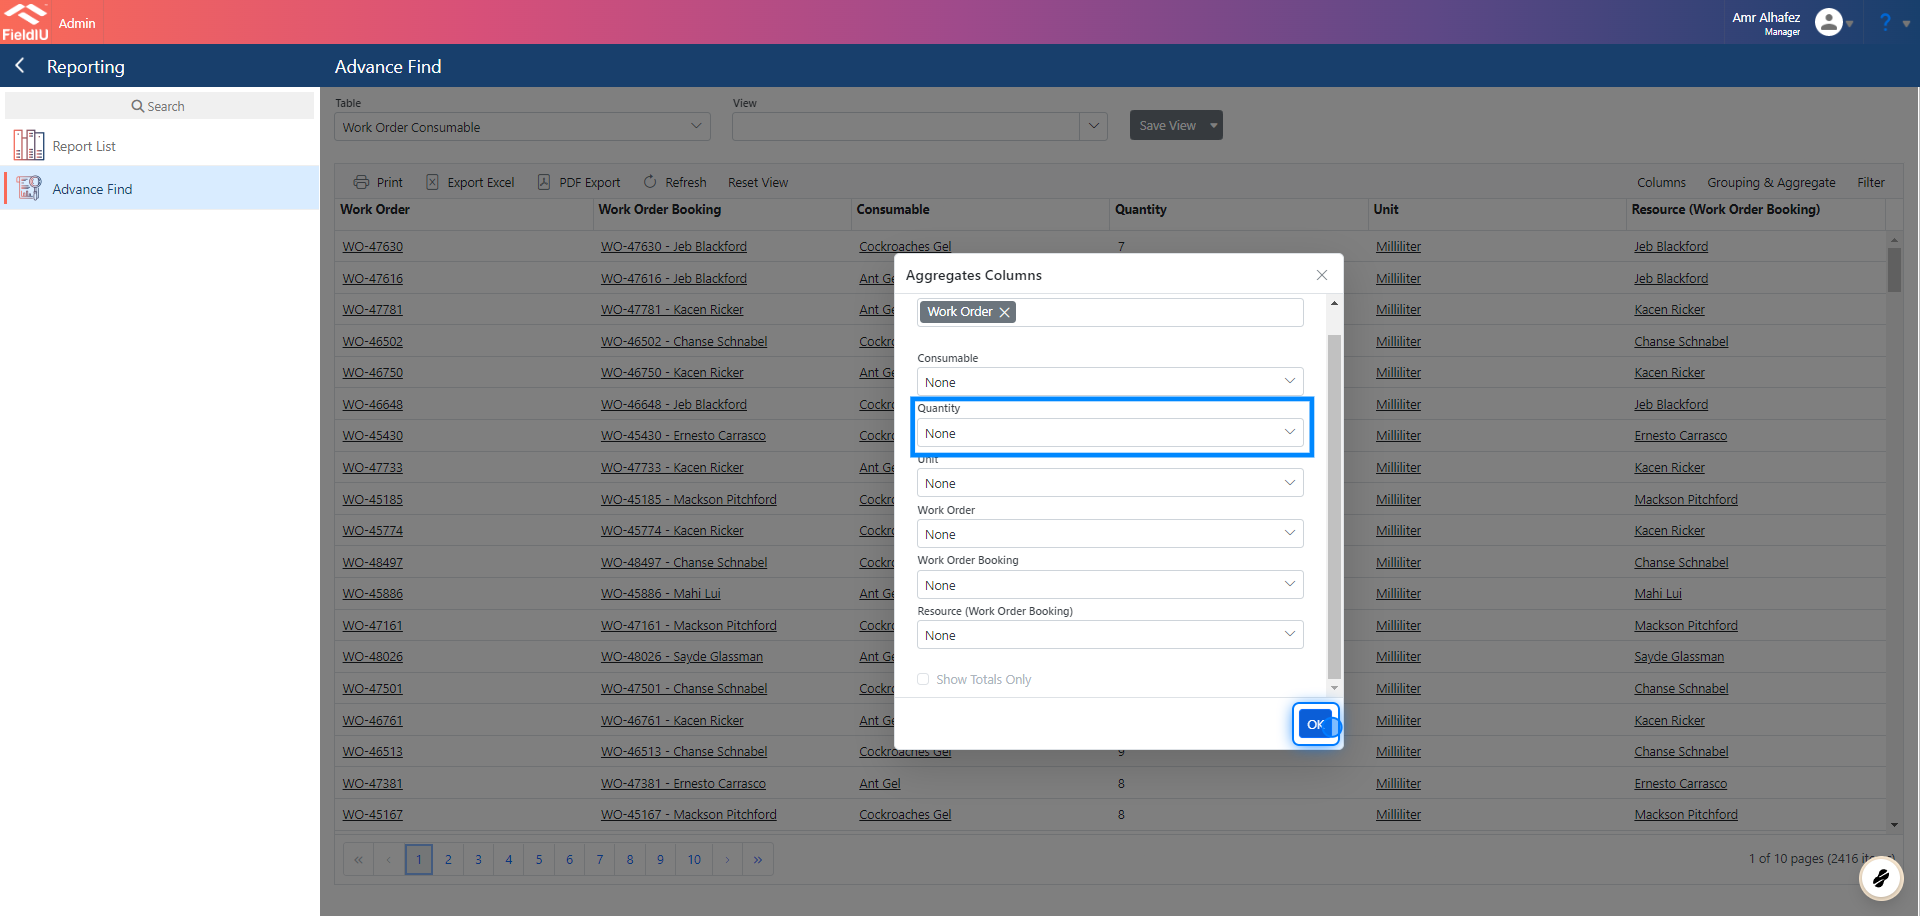
11. Aggregating
In our example, we did not select any aggregation. However, you can choose what to count or sum by selecting the column name and clicking on the desired function.
12. Totals Only
By selecting Show Totals Only , you will see the total of the aggregated data you selected.
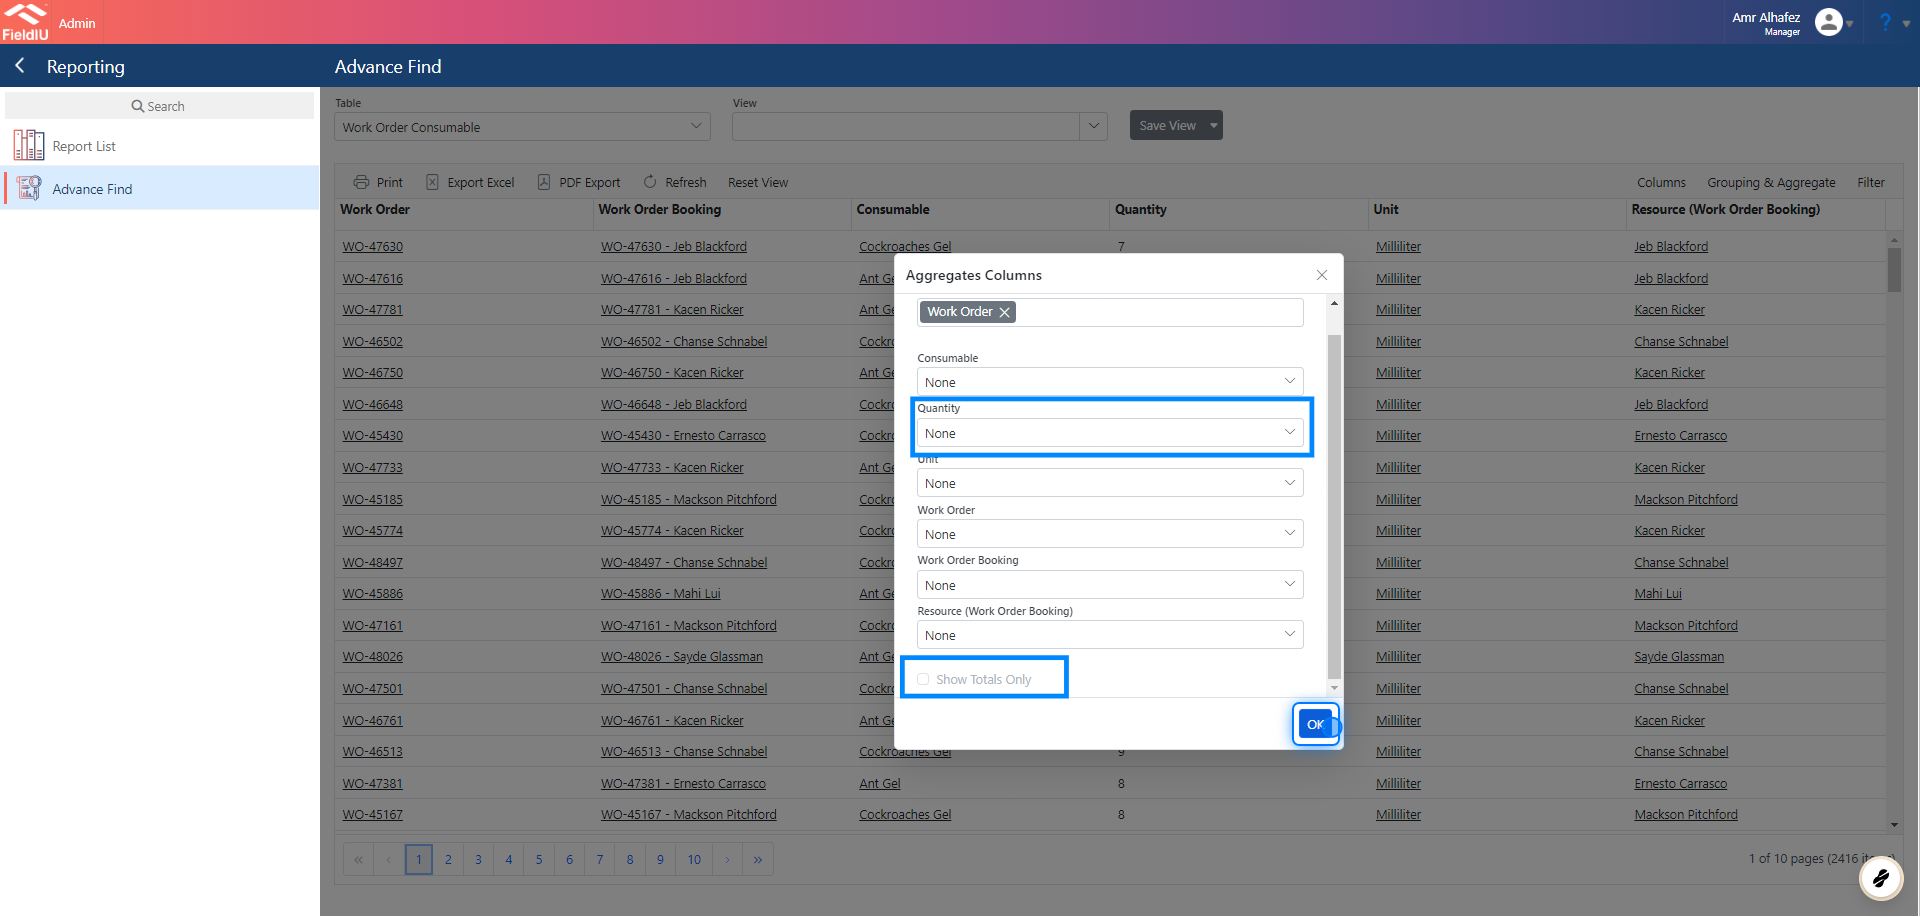
⚠️ Totals Only !
By selecting Show Totals Only , all individual data rows will be removed from the grid, and only the aggregated counts will be displayed.
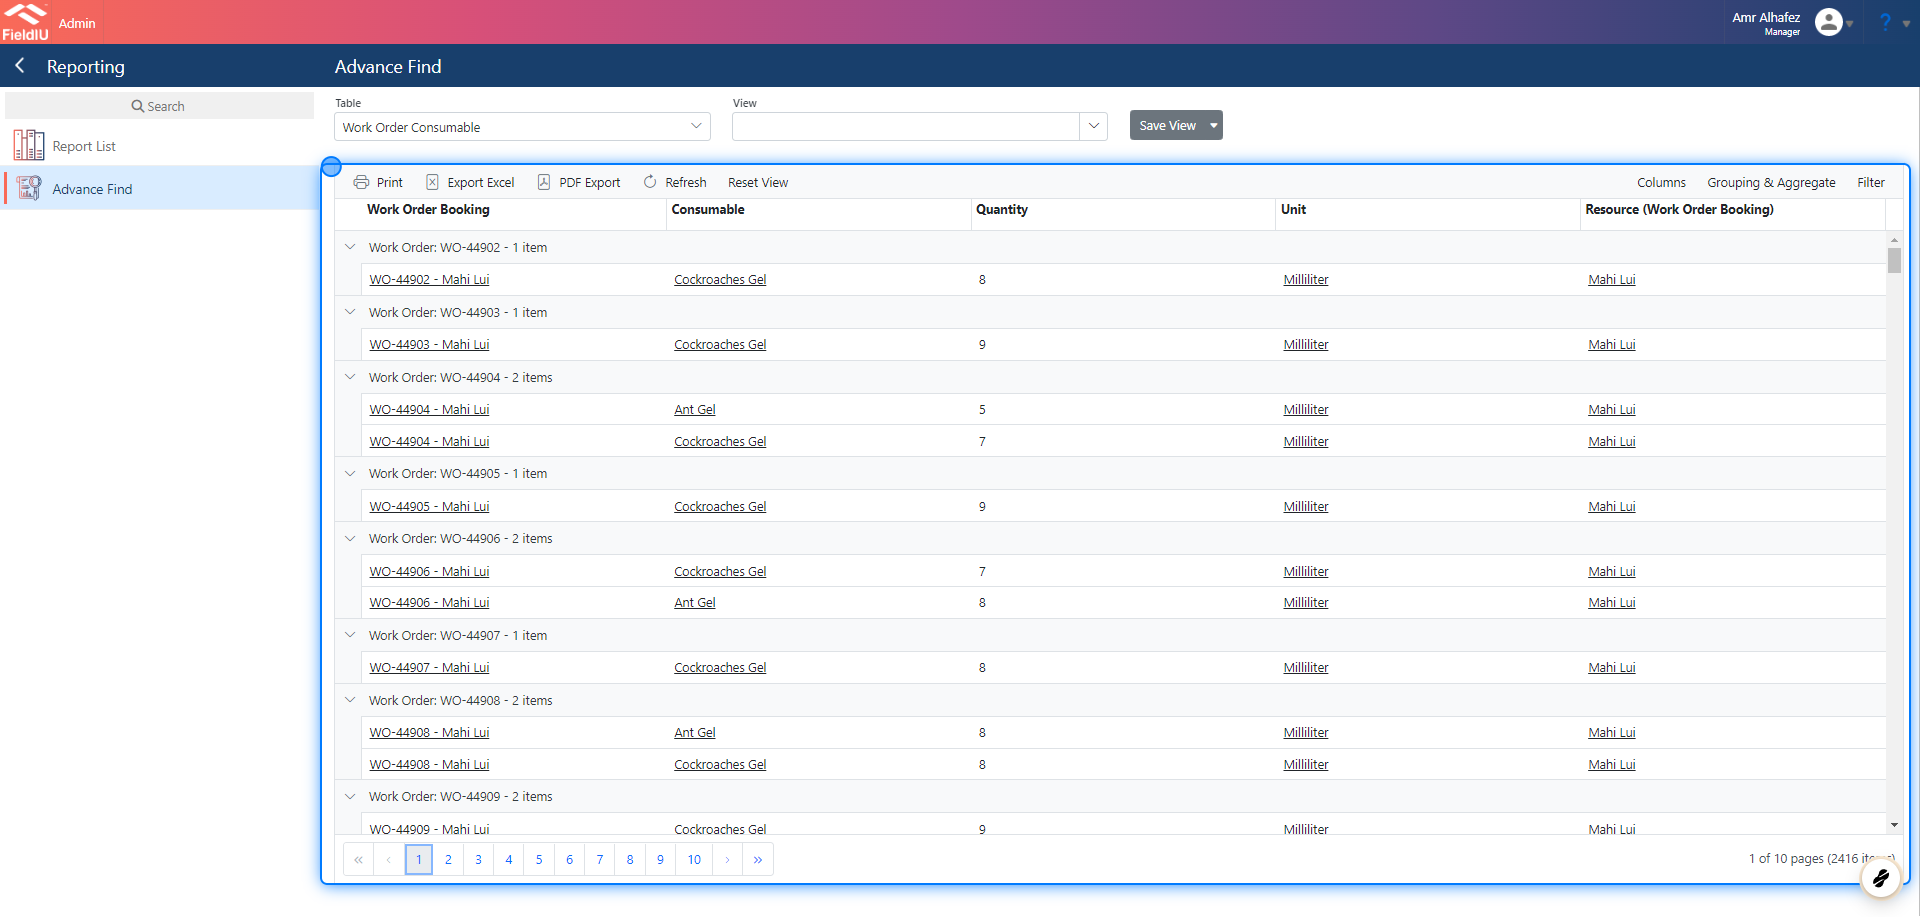
13. Final View
Here’s how the data looks after selecting groups and aggregations
Filtering
14.
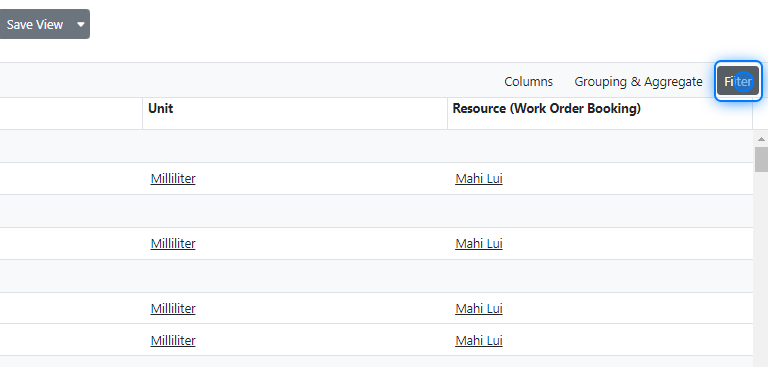
You can filtering the data as needed.
Simply click on Filter Button.
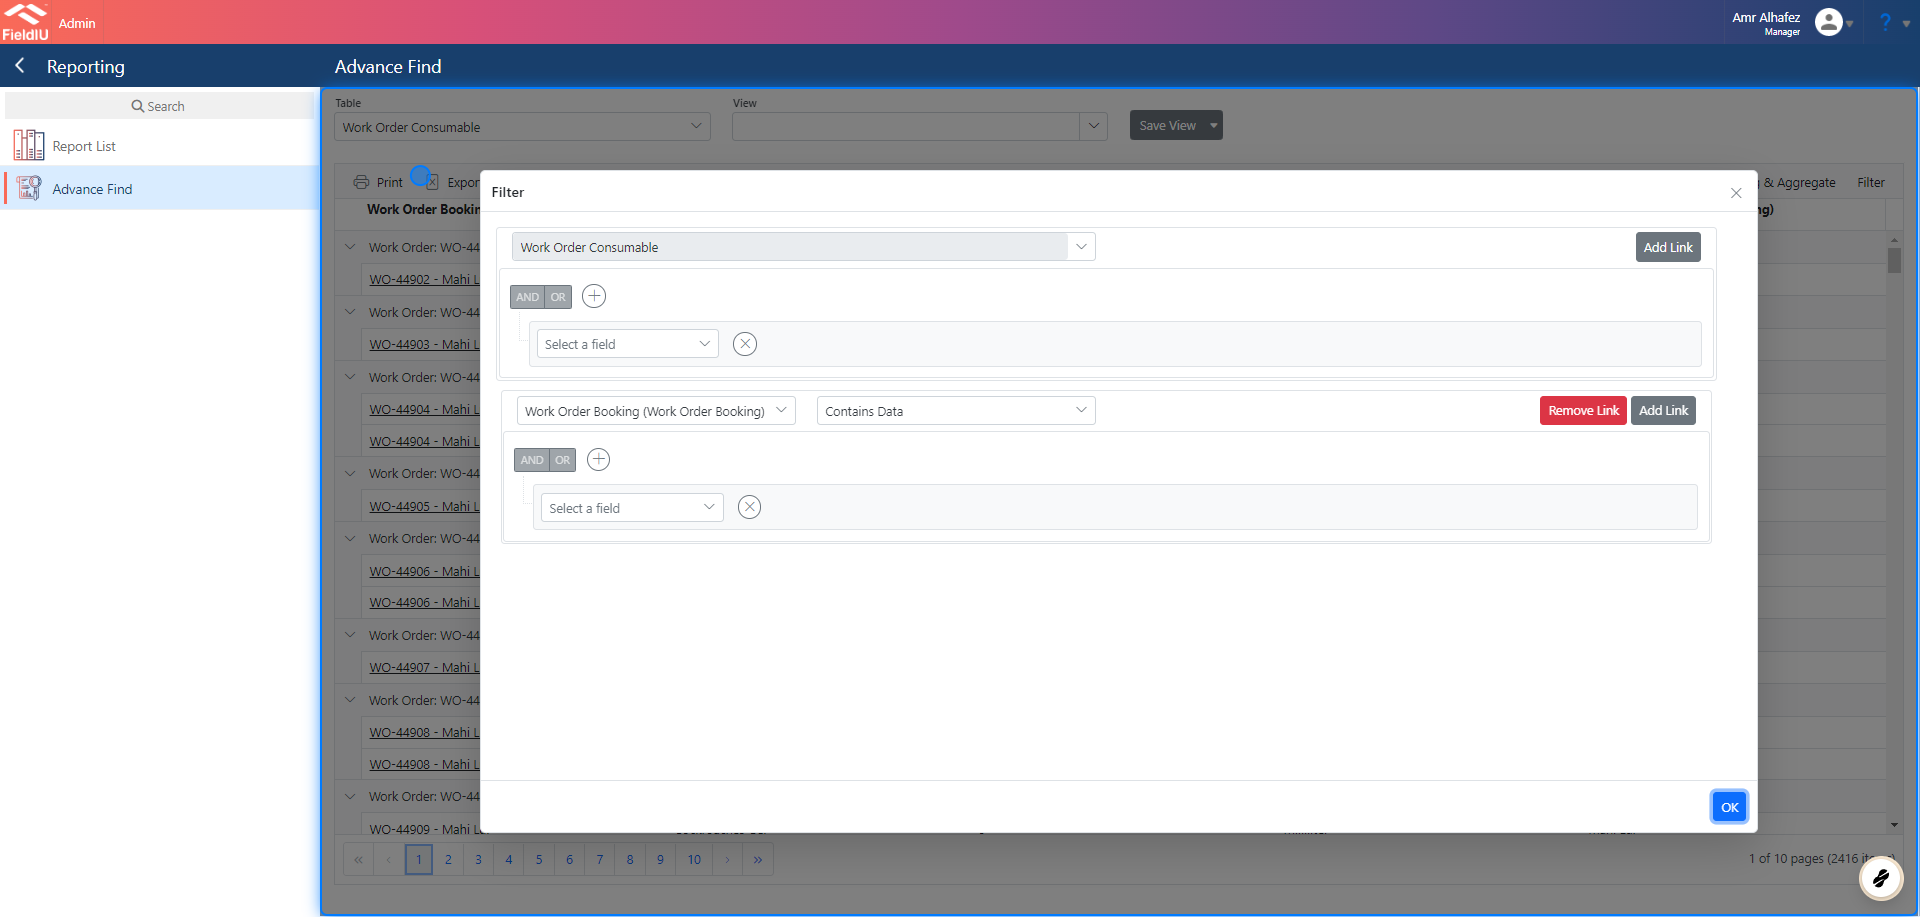
15. Filtering Window
you can find here all the necessary functions for filtering the data.
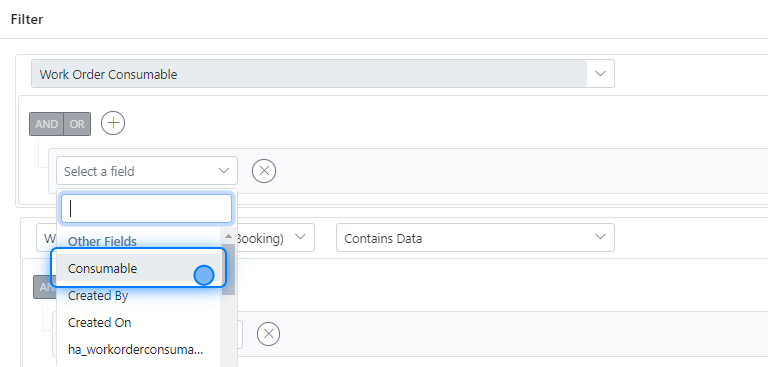
16. Filter on Work Order Consumable Table
In our example, we need to filter for Ant Gel only. To do this, we need to set criteria on the Consumable column, so make sure to select that field.
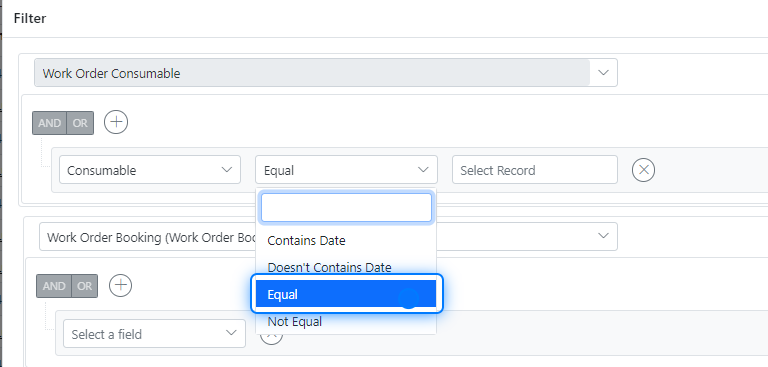
17. Selecting The Operator
Select the operator to define your filter criteria, such as Equal , Not Equal , Contains , or Does Not Contain . In our example, we need to select Equal .
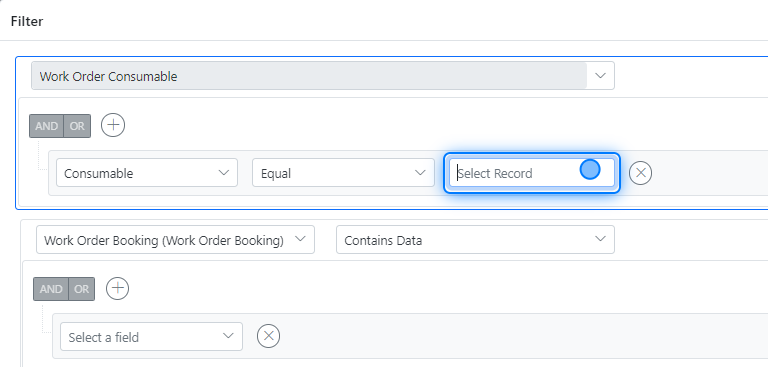
18. Select The Record
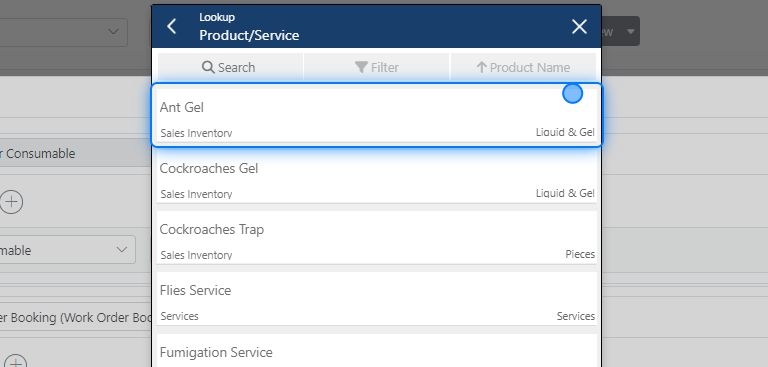
Now, select the record that you want the criteria to apply to. In our case, choose Ant Gel .
19. Records List
Sometimes, the records will appear as a list or, as in this case, in a popup window.
20. Final View
Here’s how the data looks after adding the filters
Saving
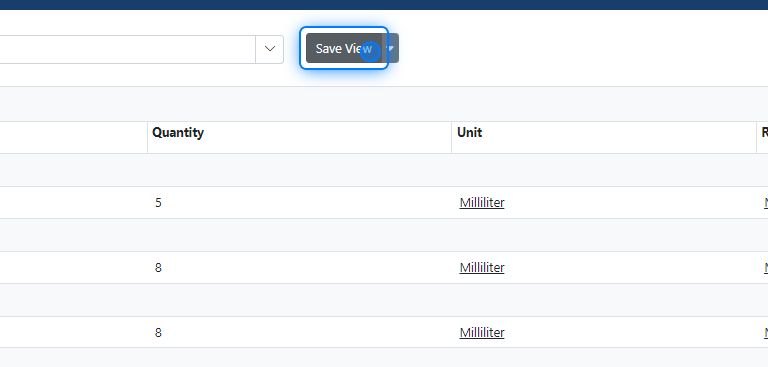
21.
To save the report and avoid repeating the previous steps in the future, simply click Save View .
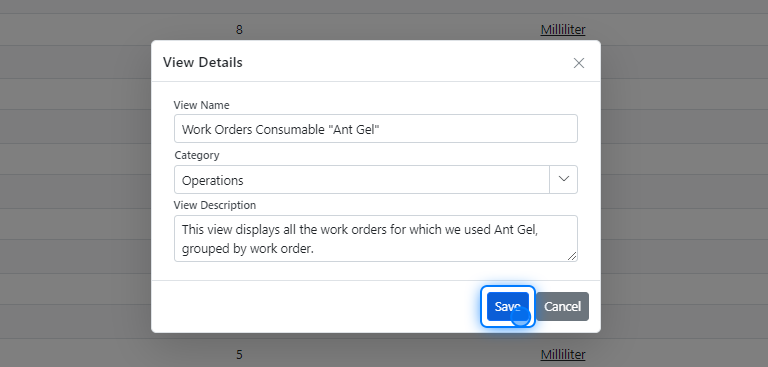
22. Saving Details
After clicking Save View , a new popup window will appear. This window contains fields you need to fill out for the view, such as Name , Category , and Description . Enter the required information and click Save .
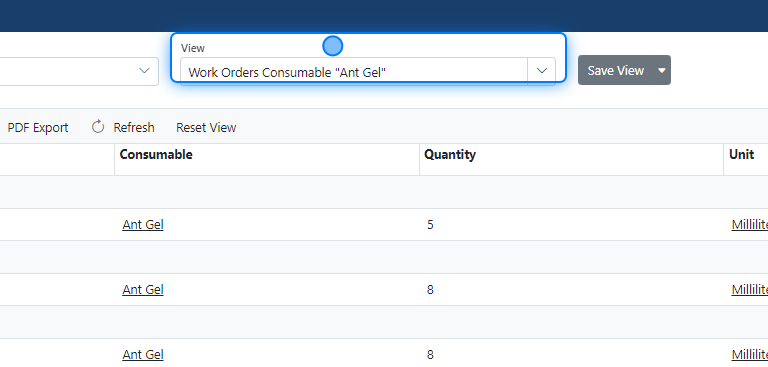
23. View Saved
After saving the view (the report), it will appear in the Views List , allowing you to select it whenever you need.
The Reports
24. Accessing Reports
From the side navigation in the Reporting section, you can access the Reporting List. Here, you will find all the reports (views) that we have saved.
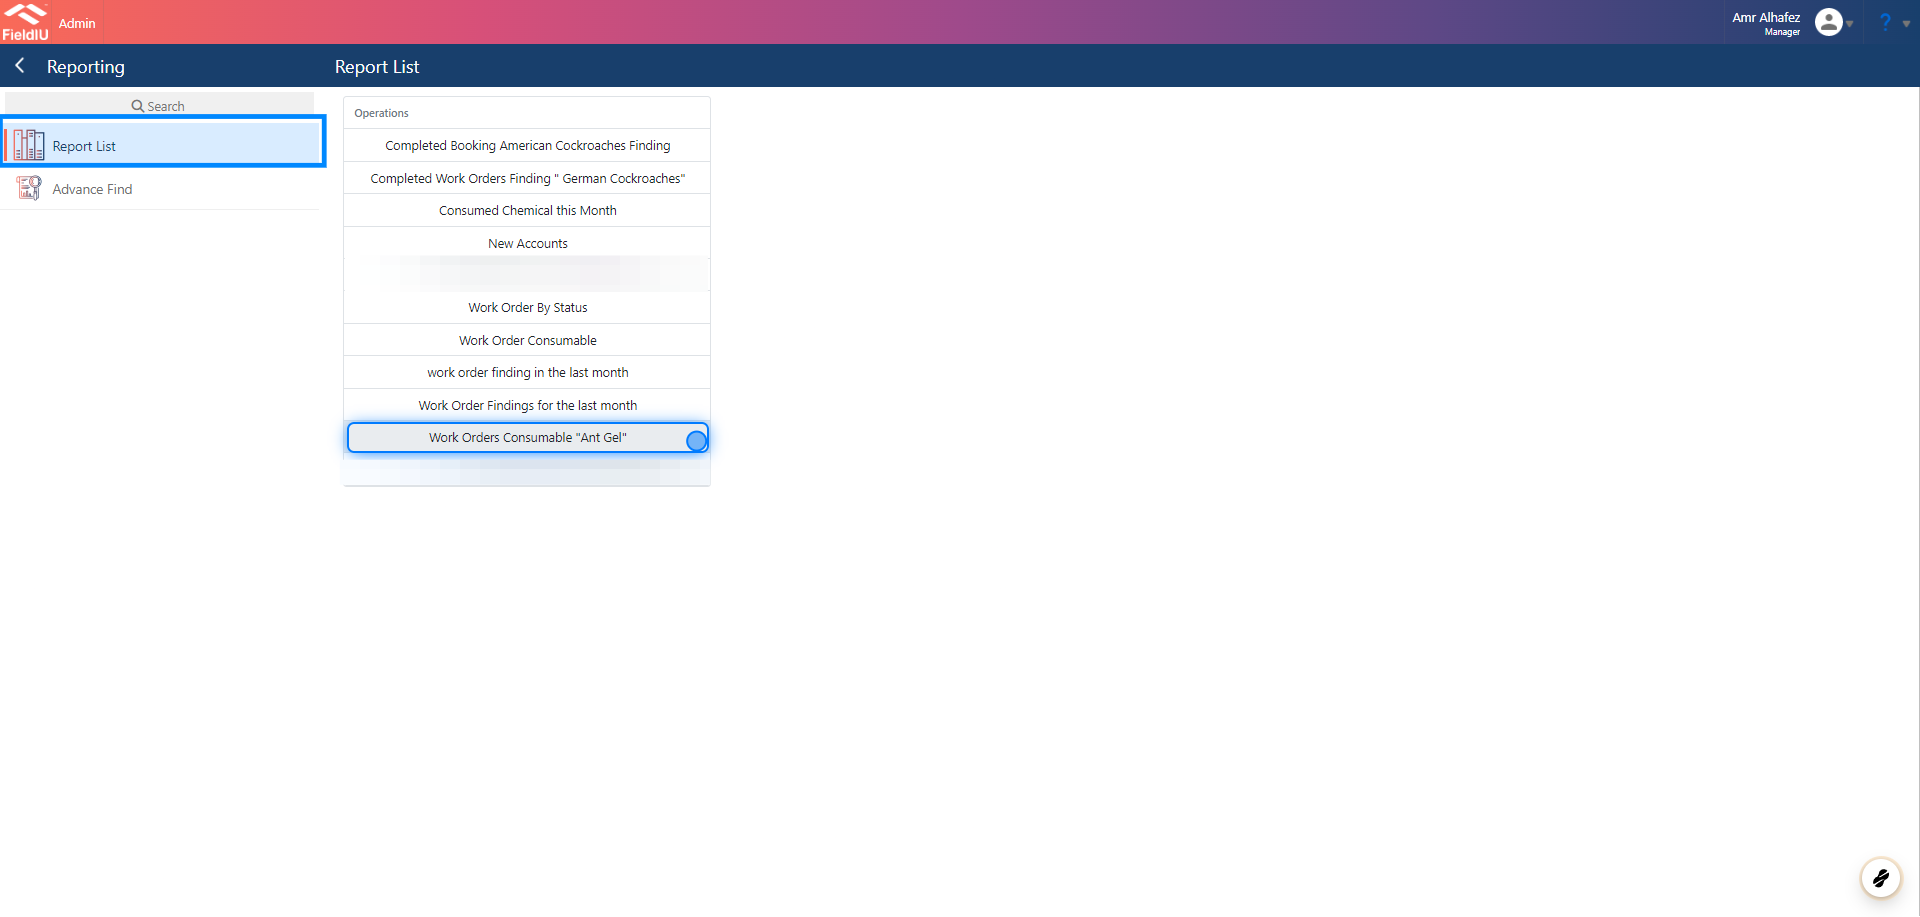
25. View The Reprot
You can easily click on a report from the Reports List , and the saved report will appear with the grouping and filtering settings you originally created.
 �����������������������