> ## Documentation Index
> Fetch the complete documentation index at: https://docs.fieldiu.com/llms.txt
> Use this file to discover all available pages before exploring further.
# Customer Portal Trend Analysis
Helps generate trend charts for better insight.
### 1. Main Window
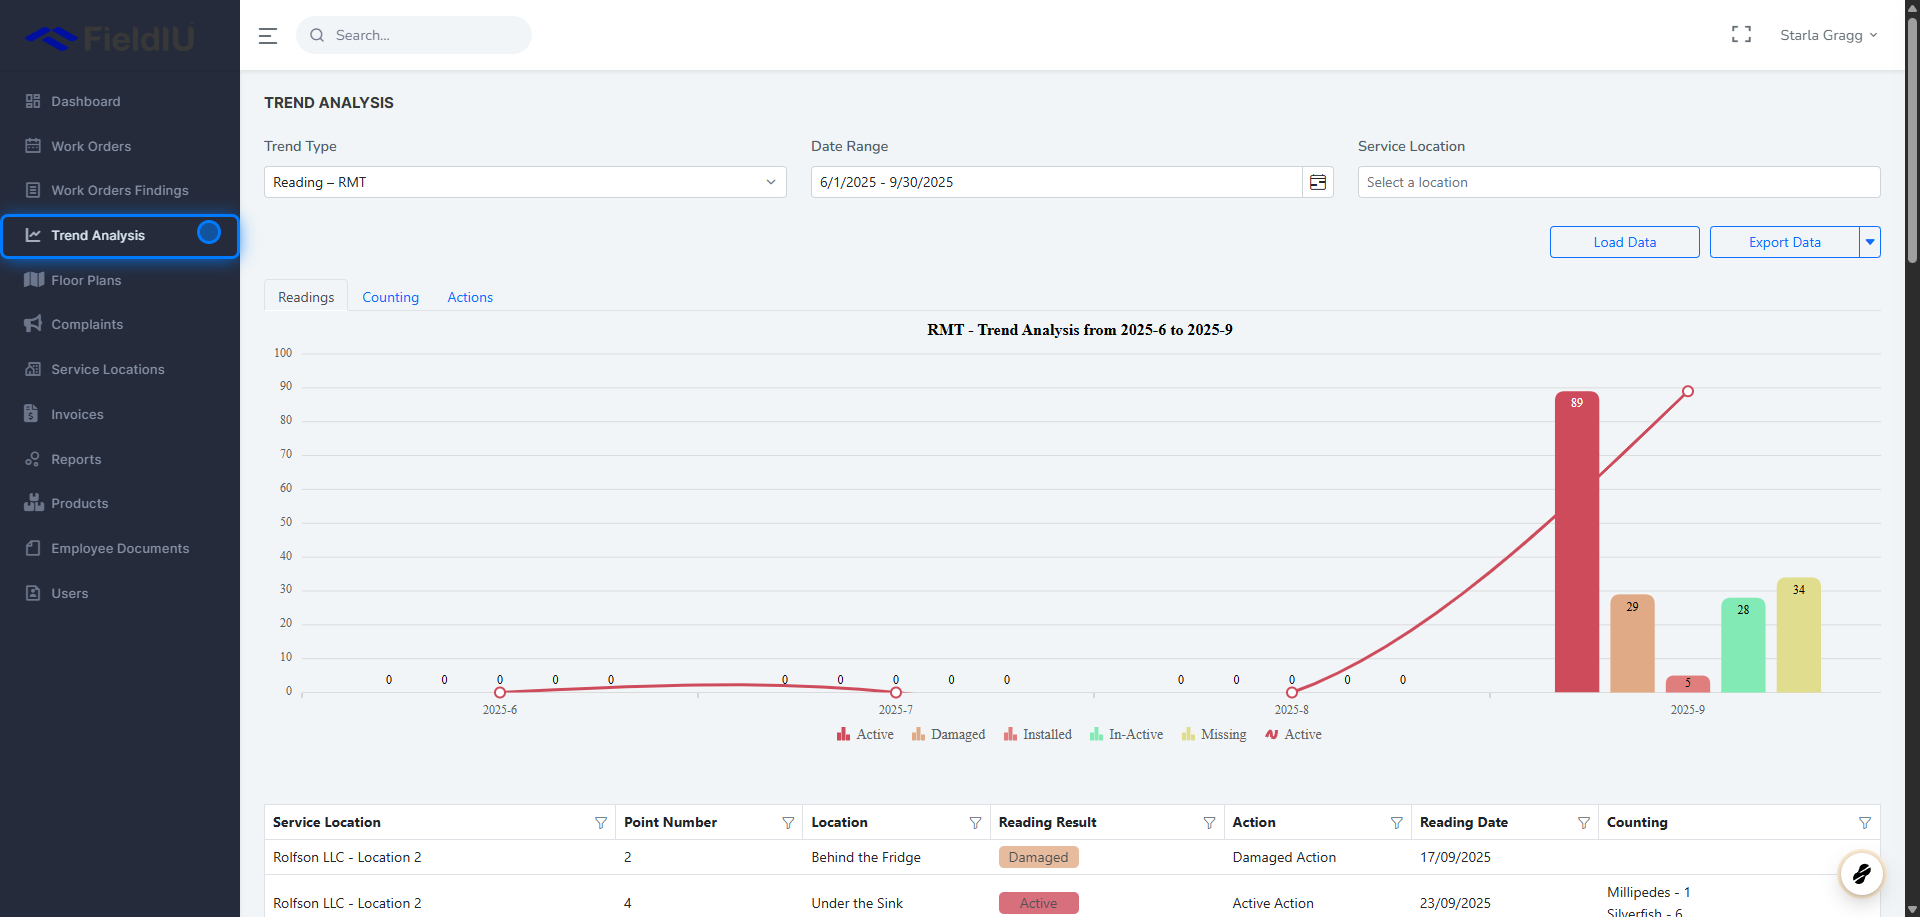
On the main screen, you will find the inputs necessary to generate your trend analysis:
* **Trend Type** : Select the type of trend you want to analyze (Readings, Consumables, Findings, Work Order Status, Completed Work Orders).
* **Date Range** : Choose the range between two specific dates.
* **Billing Account** : Specify the data for a specific customer.
* **Service Location** : Specify the data for a specific location.
 ### 2. Trend Type
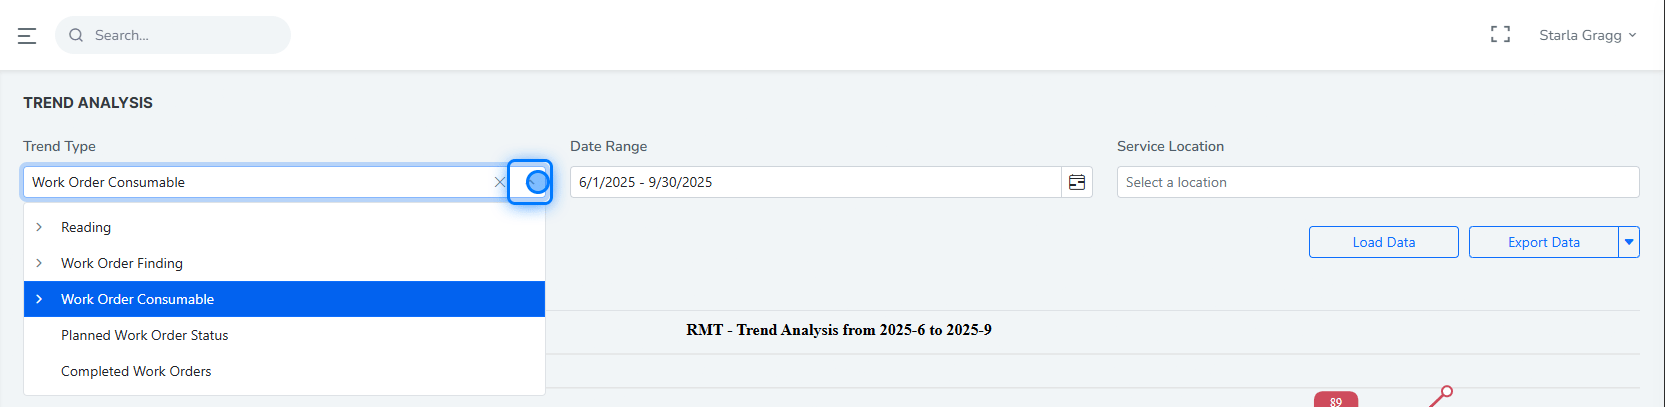
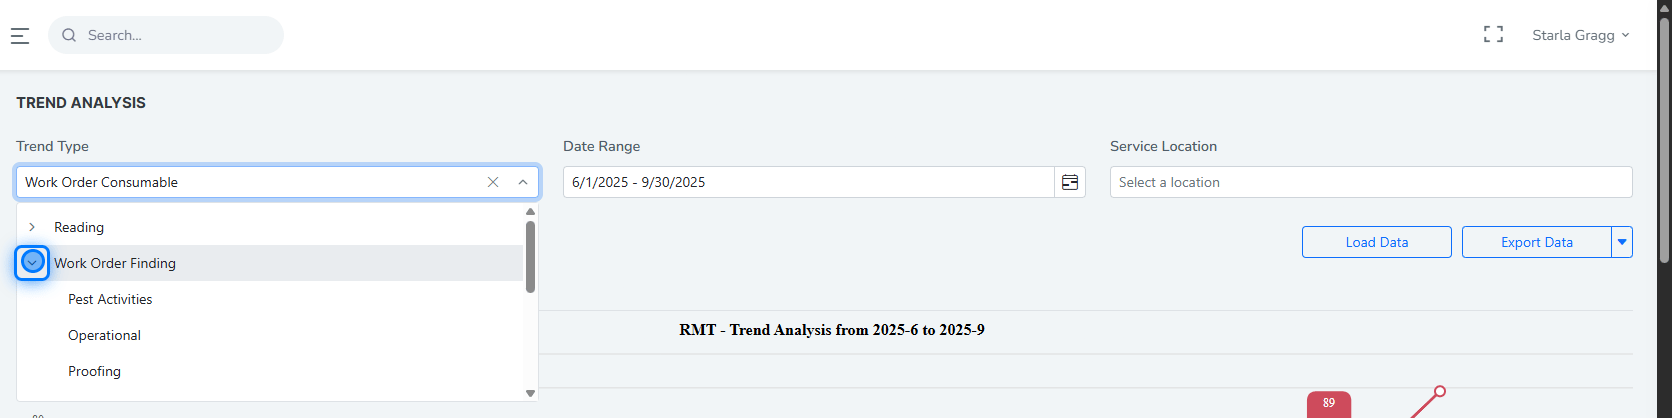
From the Trend Type, you can select the trend for weather readings (Reading Categories), Work Order Findings (Finding Category), Work Order Consumables (Products), Planned Work Order Status, or Completed Work Orders.
For Readings, Findings, and Consumables, you can choose either all or specific items.
### 2. Trend Type
From the Trend Type, you can select the trend for weather readings (Reading Categories), Work Order Findings (Finding Category), Work Order Consumables (Products), Planned Work Order Status, or Completed Work Orders.
For Readings, Findings, and Consumables, you can choose either all or specific items.
 ### 3.
 > ### 💡 If you do not select a service location, the data will be retrieved for all locations by default.
## Loading & Export
### 4.
Once you enter your data (Trend Type, Dates, and Service Location), you need to click the **Load Data** button to retrieve the results based on your selected inputs.\
You can also:
* Export the data table using the **Export Data** button
* Export the chart using the **Export Chart** option
> ### 💡 If you do not select a service location, the data will be retrieved for all locations by default.
## Loading & Export
### 4.
Once you enter your data (Trend Type, Dates, and Service Location), you need to click the **Load Data** button to retrieve the results based on your selected inputs.\
You can also:
* Export the data table using the **Export Data** button
* Export the chart using the **Export Chart** option
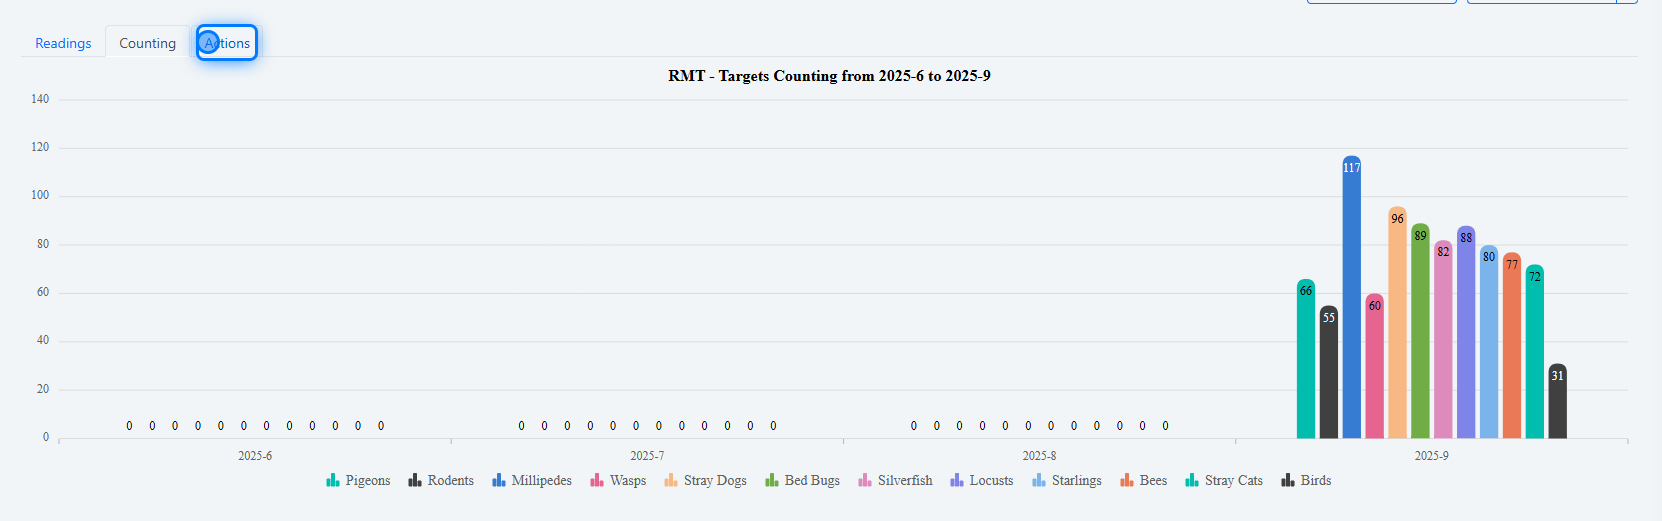
 ### 5. Charts
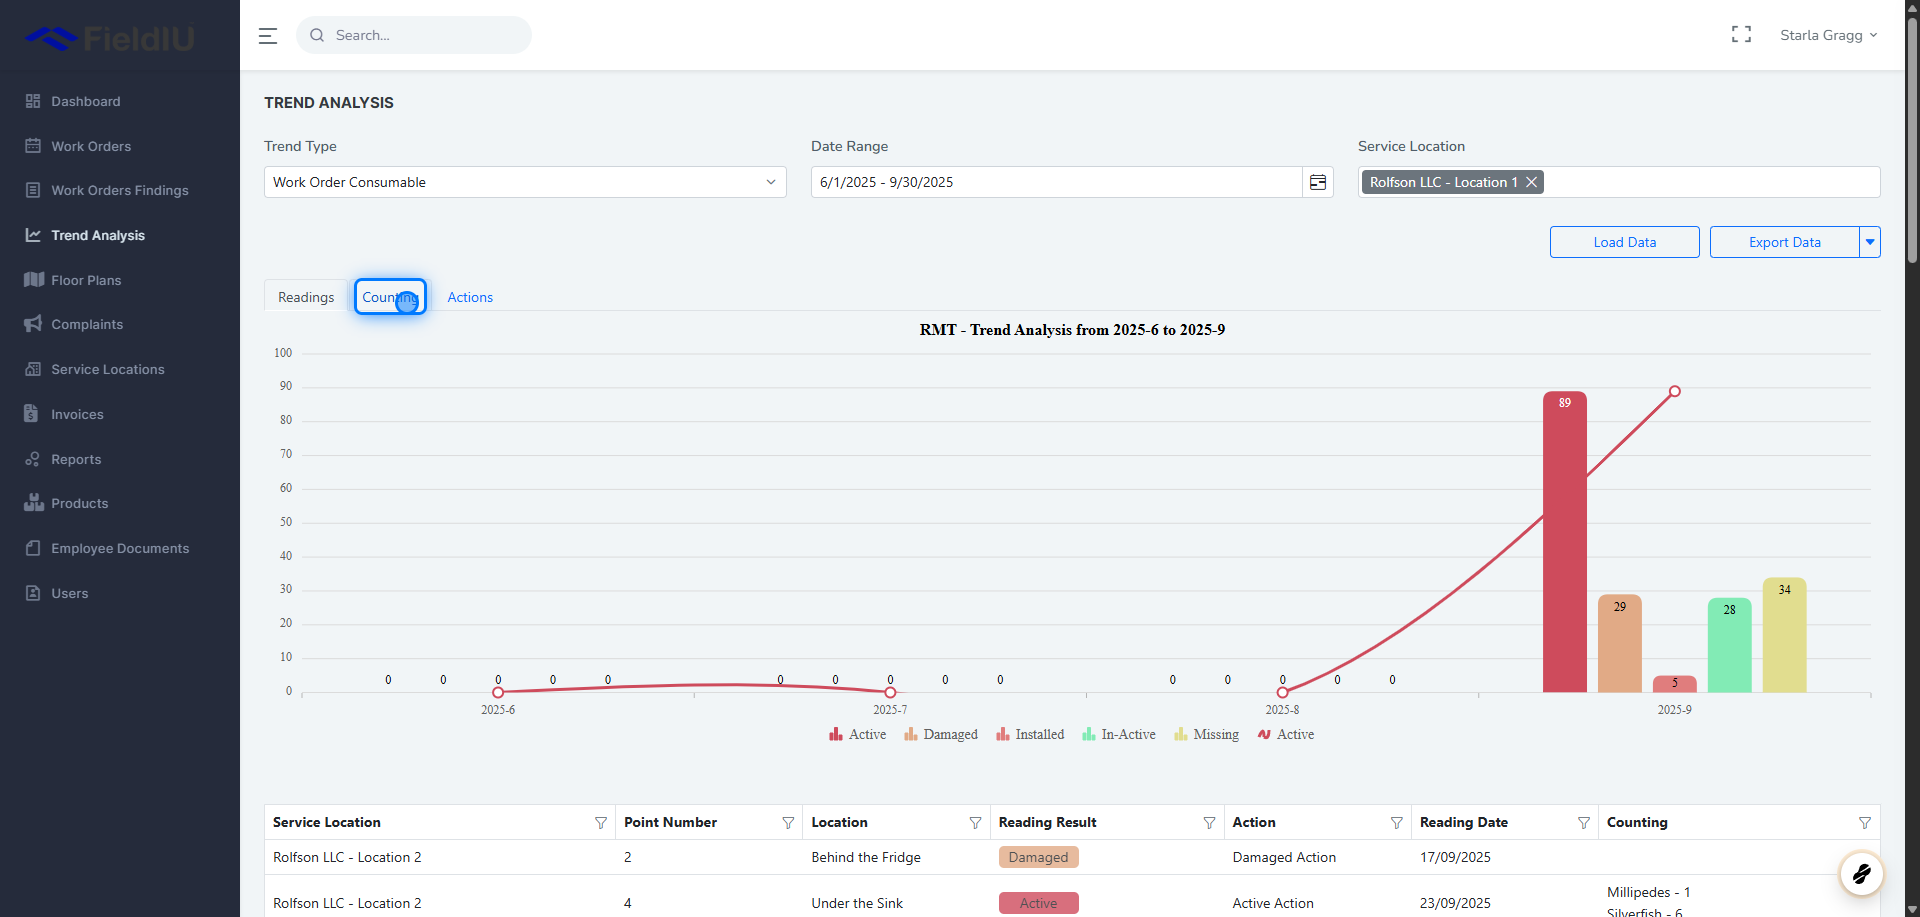
Once you load the data, charts will be generated based on your selected inputs.\
Multiple chart types may be displayed depending on the data, such as:
* **Readings**
* **Counts**
* **Actions**
### 5. Charts
Once you load the data, charts will be generated based on your selected inputs.\
Multiple chart types may be displayed depending on the data, such as:
* **Readings**
* **Counts**
* **Actions**
 ### 6.
 ### 7. Data Table
You will also see a data table containing all the loaded data.
### 7. Data Table
You will also see a data table containing all the loaded data.
 �����������������������