> ## Documentation Index
> Fetch the complete documentation index at: https://docs.fieldiu.com/llms.txt
> Use this file to discover all available pages before exploring further.
# Customer Portal Intro
The Customer Portal is an integrated webview within the Fieldiu system. It allows customers to:
* Monitor all activities related to their visits
* Submit complaints
* View scheduled work orders
* Review findings
* Check monitoring points
* And More Helpful things .
### 1. Main Window
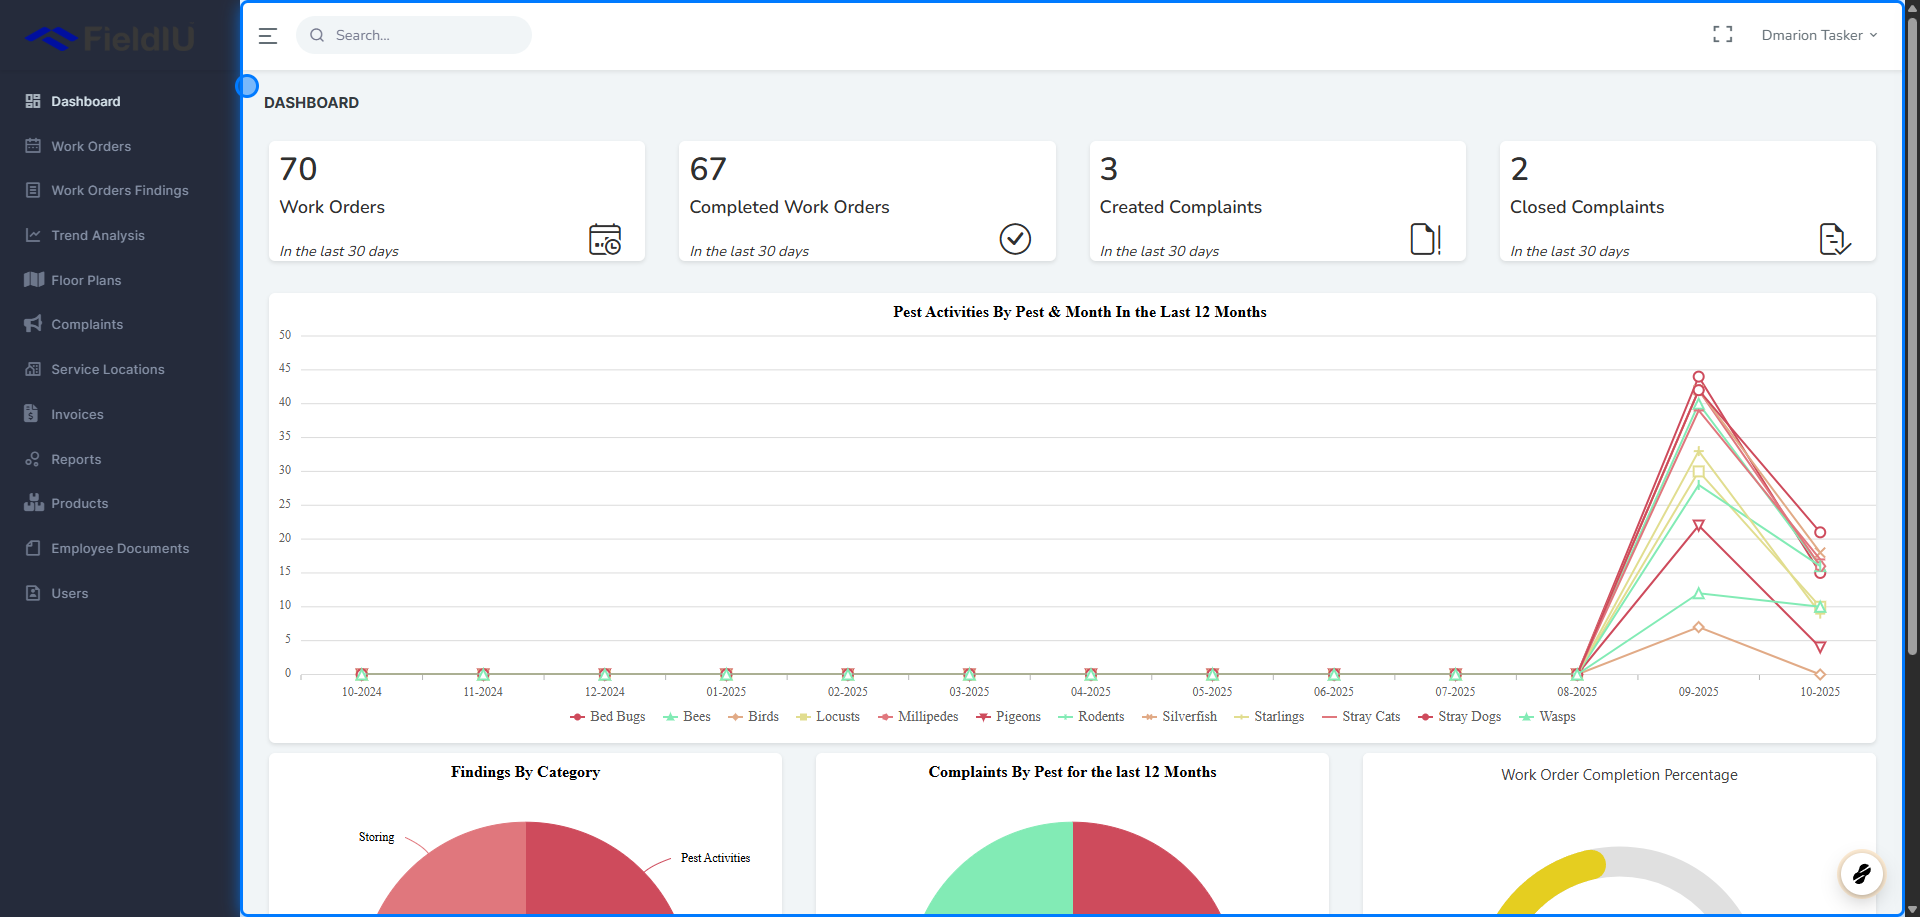
The main window features a sidebar menu that includes the following sections:
* **Dashboard** : Provides an overview of work orders and related findings.
* **Work Orders** : Displays detailed information about all work orders.
* **Work Order Findings** : Shows all findings recorded during work orders.
* **Trend Analysis** : Helps generate trend charts for better insight.
* **Floor Plans** : Allows you to view floor plans and readings points in the floor.
* **Complaints** : Used to manage and track customer complaints.
* **Service Locations** : Enables tracking of all service locations and the work orders associated with them.
* **Invoices** : Manage all invoices and payment details.
* **Reports** : Access all reports generated by the system.
* **Products** : View all products used at customer locations, including product certificates and detailed information.
* **Employee Documents** : Allows customers to access company employee documents to facilitate access permissions without needing to request documents manually.
* **Users** : Manage all users who have access to the customer portal.
 ## Dashboard
### 2. Work Orders & Complaints
**Work Orders & Complaints Section**\
This section displays statistics from the last 30 days, including:
* Total Work Orders
* Completed Work Orders
* Created Complaints
* Closed Complaints
## Dashboard
### 2. Work Orders & Complaints
**Work Orders & Complaints Section**\
This section displays statistics from the last 30 days, including:
* Total Work Orders
* Completed Work Orders
* Created Complaints
* Closed Complaints
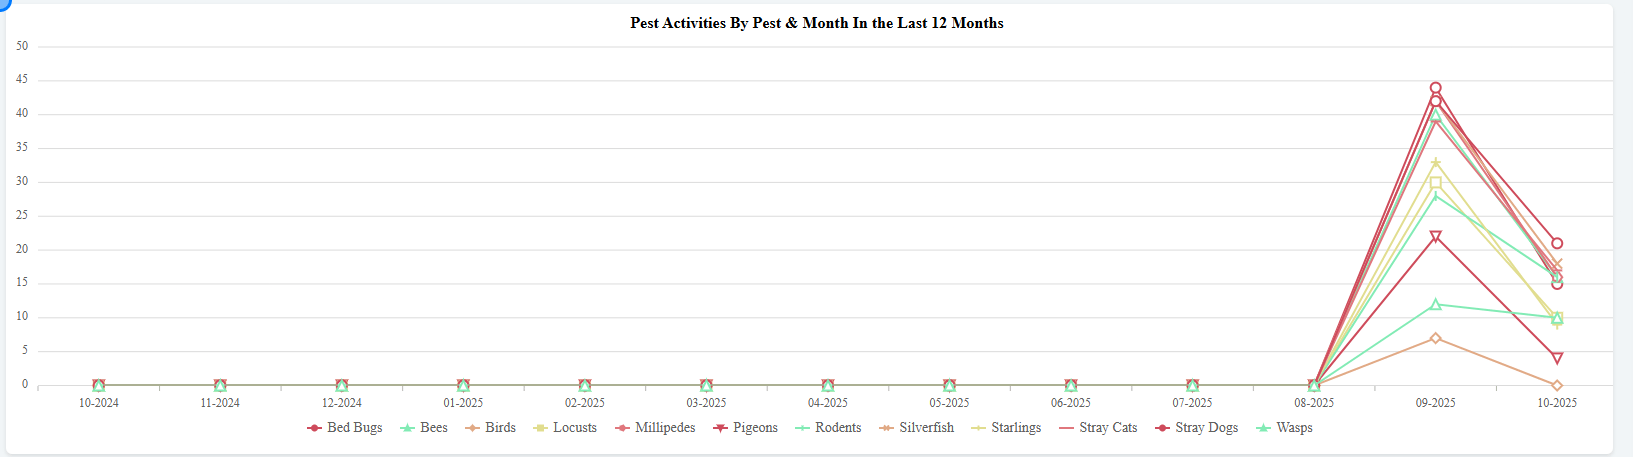
 ### 3. Pest Activates By Pest & Months for the last 12 Months
 ### 4. Pie Charts
The pie charts provide visual summaries of the following data for the last 12 months:
* Findings by category
* Complaints by pest type
* Work order completion percentage
### 4. Pie Charts
The pie charts provide visual summaries of the following data for the last 12 months:
* Findings by category
* Complaints by pest type
* Work order completion percentage
 �����������������������